Here’s something that’ll blow your mind: the way fintech companies decide whether to lend you money is getting a serious upgrade. And I’m not talking about minor tweaks to old formulas — I’m talking about reinforcement learning algorithms that literally learn from every lending decision they make.
Plotly for Machine Learning: Create Interactive ML Visualizations
on
Get link
Facebook
X
Pinterest
Email
Other Apps
Look, I’ll be honest with you — I’ve spent way too many hours staring at matplotlib plots that look like they were designed in the ’90s. Static, boring, and about as interactive as a brick wall. Then I discovered Plotly for my machine learning projects, and honestly? Game changer.
If you’ve ever wanted to actually interact with your ML visualizations — zoom in on that weird cluster, hover over data points to see what’s going on, or share something with your team that doesn’t look like you threw it together in five minutes — you need Plotly in your life.
Plotly for Machine Learning
Why Plotly Beats Traditional ML Visualization
Here’s the thing about machine learning: you’re dealing with complex, multi-dimensional data that changes as your model trains. Static plots just don’t cut it anymore.
Plotly gives you interactivity right out of the box. You can hover over data points to see exact values, zoom into specific regions of your confusion matrix, or toggle different classes on and off in your decision boundary plot. Try doing that with a basic matplotlib chart. Spoiler alert: you can’t.
I remember the first time I showed my team a Plotly dashboard instead of a PowerPoint full of screenshots. The ability to explore the data themselves, click around, and ask “what if” questions? That sold them immediately. No more “can you regenerate that plot with different parameters?” emails flooding my inbox.
Setting Up Plotly for Your ML Projects
Getting started is stupidly simple. You’ll need Plotly installed, obviously:
Plotly works beautifully with the usual suspects in your ML toolkit — pandas, NumPy, scikit-learn. Everything plays nice together, which is refreshing in the Python ecosystem where package conflicts can be… well, let’s not go there.
The two main libraries you’ll use are:
plotly.express — High-level interface for quick plots
plotly.graph_objects — Low-level control for custom visualizations
Start with Express. Seriously. It’ll get you 80% of the way there with 20% of the effort.
Visualizing Training Performance
Ever watched your model train and wondered if it’s actually learning anything or just having an existential crisis? Interactive loss curves are your new best friend.
Instead of waiting for training to finish and then plotting, you can create live updating plots that show your loss decreasing (hopefully) in real-time. I use this for every neural network I train now. FYI, it’s incredibly satisfying to watch that loss curve drop.
Here’s what makes Plotly shine for training metrics:
Multiple metrics on one plot — Loss, accuracy, precision, whatever you’re tracking
Hover details — See exact epoch numbers and metric values
Zoom functionality — Notice something weird between epochs 50–75? Zoom right in
Export capability — Save as HTML and share with anyone, no Python required
The beauty is you can spot issues immediately. Is your validation loss diverging from training loss? Overfitting alert. Is everything flat after epoch 10? Maybe bump up that learning rate.
Creating Interactive Confusion Matrices
Confusion matrices are essential for classification tasks, but let’s be real — they can get messy with more than a few classes. Plotly turns them into something actually useful.
With an interactive heatmap, you can hover over each cell to see the exact count and percentage. You can also customize colors to make misclassifications pop visually. I like using a diverging color scheme that makes the diagonal (correct predictions) one color and errors another.
Key features for ML confusion matrices:
Hover annotations showing true vs predicted labels
Percentage and absolute count displays
Click-to-zoom for high-dimensional problems
Easy integration with scikit-learn’s confusion_matrix function
Pro tip: normalize your confusion matrix by row (true labels) so you can see what percentage of each class gets misclassified. Way more informative than raw counts when you have class imbalance — and let’s face it, you probably do.
Decision Boundary Visualization
Want to actually see what your classifier is doing? Decision boundaries show you how your model carves up the feature space.
I’ll admit, this is where things get fun. You can create 2D or 3D decision boundaries that you can rotate, zoom, and explore. Ever wondered why your model misclassifies certain regions? The answer might be staring you in the face once you visualize the boundary.
Plotly makes this interactive in ways that are genuinely useful:
Rotate 3D plots to see boundaries from different angles
Toggle individual classes on/off to reduce clutter
Hover over misclassified points to inspect their features
Overlay training vs test points to spot overfitting
For high-dimensional data, you’ll need to use PCA or t-SNE to reduce dimensions first. But once you do, watching a neural network’s decision boundary evolve during training? Chef’s kiss. :)
Feature Importance and SHAP Values
Model interpretability isn’t optional anymore. Stakeholders want to know why your model made a prediction, not just what it predicted.
Plotly’s bar charts and waterfall plots make feature importance visualizations actually interpretable. You can sort features by importance, hover to see exact values, and even create linked plots where clicking a feature highlights it across multiple visualizations.
Beeswarm plots that let you identify patterns in feature contributions
I’ve used these in production ML systems where we needed to explain predictions to customers. The ability to share an HTML file that anyone can open and explore — without installing Python or any dependencies — saved me countless hours of making custom reports.
Clustering and Dimensionality Reduction
K-means, DBSCAN, hierarchical clustering — whatever your poison, visualizing clusters interactively helps you pick the right number of clusters and validate your results.
You can create scatter plots where each cluster is a different color, and hovering shows you which cluster each point belongs to plus its features. This is huge for debugging. I once spent two days wondering why my clustering was garbage until I visualized it in Plotly and realized I’d forgotten to scale my features. Facepalm moment, but at least I caught it.
3D scatter plots are particularly useful for visualizing techniques like t-SNE or UMAP. You can rotate the plot to see if clusters that look merged from one angle are actually separated in 3D space. IMO, this is way better than trying to project down to 2D and losing information.
ROC Curves and Precision-Recall Curves
These curves are ML 101, but Plotly adds some nice touches. You can plot multiple models on the same chart and toggle them on/off to compare. Each model gets its own trace with hover information showing the exact threshold, TPR, and FPR.
What I love about interactive ROC curves:
Hover to see the exact threshold for any point on the curve
Compare multiple models by toggling traces
Zoom into regions of interest (like high recall areas)
Export the plot to show stakeholders without running code
For imbalanced datasets, precision-recall curves are more informative than ROC curves. Plotly handles these just as well, and you can even create linked plots where hovering over a point on the PR curve highlights the corresponding point on the ROC curve.
Hyperparameter Tuning Visualizations
Grid search and random search generate tons of data about which hyperparameters work best. Plotly’s parallel coordinates plots are perfect for this.
You can visualize multiple hyperparameters simultaneously, with each line representing one set of hyperparameters and its resulting score. Brush over high-performing regions to see which parameter combinations consistently work well.
This helped me spot patterns I wouldn’t have noticed otherwise:
Learning rates between 0.001–0.01 consistently outperformed others
Dropout rates above 0.5 tanked performance across the board
Batch size had almost no effect (saved me time on future experiments)
You can also create 3D surface plots showing how two hyperparameters interact to affect model performance. Way more insightful than staring at a table of numbers.
Neural Network Architecture Visualization
Okay, this one’s a bit niche, but if you’re working with neural networks, visualizing the architecture interactively can help you communicate what you’ve built.
You can create node-link diagrams showing layers, connections, and even activation patterns. I’ve used this when presenting to non-technical stakeholders who wanted to “see” the neural network. Spoiler: they still didn’t really understand it, but they felt better. :/
Anomaly Detection and Outlier Visualization
Spotting outliers visually is surprisingly effective. Plotly lets you create scatter plots where you can color-code anomalies differently and hover to see why they were flagged.
For time-series anomaly detection, interactive line plots let you zoom into specific time ranges and hover over anomalous points to see their exact values. I use this constantly for monitoring ML systems in production — way faster than querying logs.
Sharing and Deployment
Here’s where Plotly really shines over alternatives: sharing is effortless. Export as HTML, and literally anyone with a browser can open and interact with your visualizations. No Python environment, no dependencies, no setup.
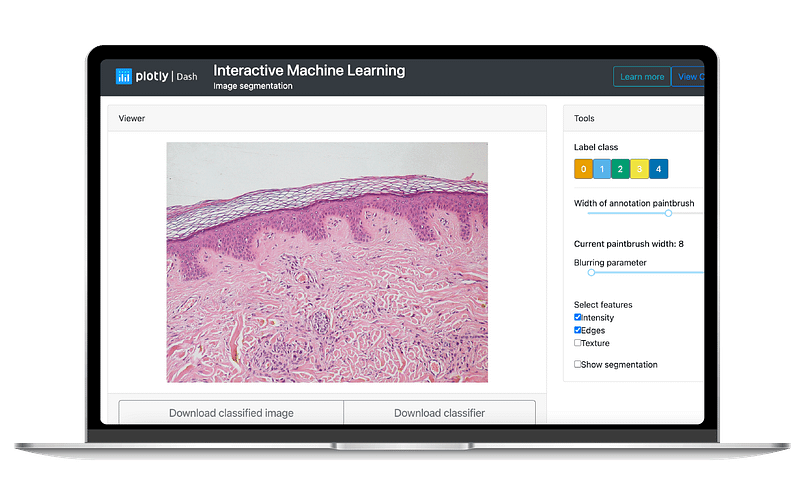
I’ve built entire ML dashboards using Plotly Dash that non-technical team members use daily. They can explore model performance, filter by date ranges, and drill down into specific predictions — all without writing a line of code.
Final Thoughts
Look, you don’t need Plotly for machine learning. You can absolutely stick with matplotlib and seaborn and get the job done. But why would you want to?
Interactive visualizations aren’t just prettier — they’re genuinely more useful for exploring ML models, debugging issues, and communicating results. The time you invest in learning Plotly (which, honestly, isn’t much) pays off the first time you catch a subtle bug by exploring an interactive plot.
Start simple. Pick one visualization you make regularly — confusion matrices, loss curves, whatever — and recreate it in Plotly. I guarantee you’ll find the interactivity addictive. Then expand from there.
Your models are complex. Your visualizations should help you understand them, not make things more confusing. Plotly does that for me, and I think it’ll do the same for you.
Comments
Post a Comment